This part contents two methods to visulize the generated binary image in 1.1
%%%%%%%%%%%%%%%%%%%%%%%%%%%%%%%%%%%%%%%%%
Method 1.
(Read x,y,z coordinates and radius of each particle)
clc
clear all
tic
p=xlsread('bbb.csv'); % Read x,y,z,r info from csv file
center=p(:,1:3);
radius=p(:,4);
resul = 0.1; % Parameter to control image resolution
[x,y,z]=meshgrid(0:resul:10,0:resul:10,0:resul:10);
for i=1:numel(radius)
[B(i).bw]=sqrt((x-center(i,1)).^2+(y-center(i,2)).^2+(z-center(i,3)).^2)<=radius(i);
end
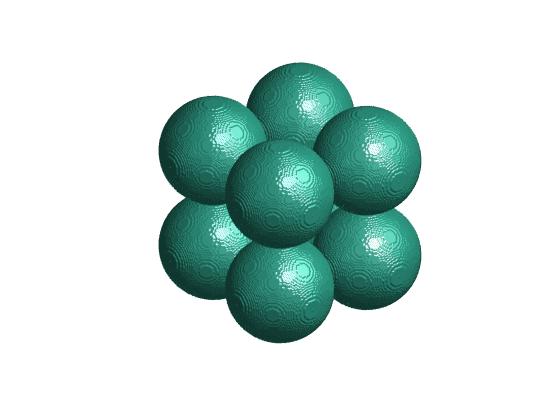
% Visualization
figure
for i=1:numel(radius)
isosurface(x,y,z,B(i).bw,0.5);
end
% view(2) % To check if they are entities
axis equal
% Logical OR For all particles
E=zeros(size(x,1),size(y,1),size(z,1));
F= logical(E);
for t=1:numel(radius);
F=F|B(t).bw;
end
toc;
*Sample image is shown
%%%%%%%%%%%%%%%%%%%%%%%%%%%%%%%%%%%%%%%
Method 2
(Read binary images of all the slices)
clc
clear all
tic
listOfimages=dir('eight_spheres\*.tif');
numberOftifs=numel(listOfimages);
for i=1:numberOftifs
imageName=strcat('eight_spheres\','data',num2str(i),'r.tif');
I{i}=imread(imageName);
end
% 2D stacks to 3D array
threeDarray=cat(3,I{1,1},I{1,2});
for i=3:numberOftifs
threeDarray=cat(3,threeDarray,I{1,i});
end
[A,B,C]=size(threeDarray);
threeDarray = logical(threeDarray);
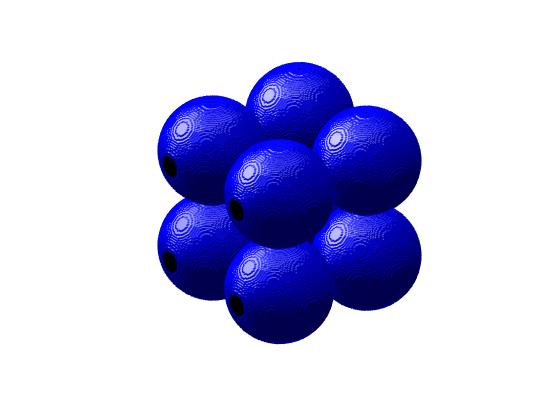
% VISUALIZATION
fv=isosurface(threeDarray,.5,threeDarray); % surface rendering
figure
p=patch(fv,'FaceColor','blue','EdgeColor','none');
patch(isocaps(threeDarray,0.5));
isonormals(threeDarray,p);
camlight left;
camlight(5,6);
lighting gouraud;
view(3);
axis equal
axis off
toc
*Sample image is show as