|
|

DARLA @ the Columbia River Mouth:
OSU X-Band radar (May 2013 - )
1. Basic radar products
|
|
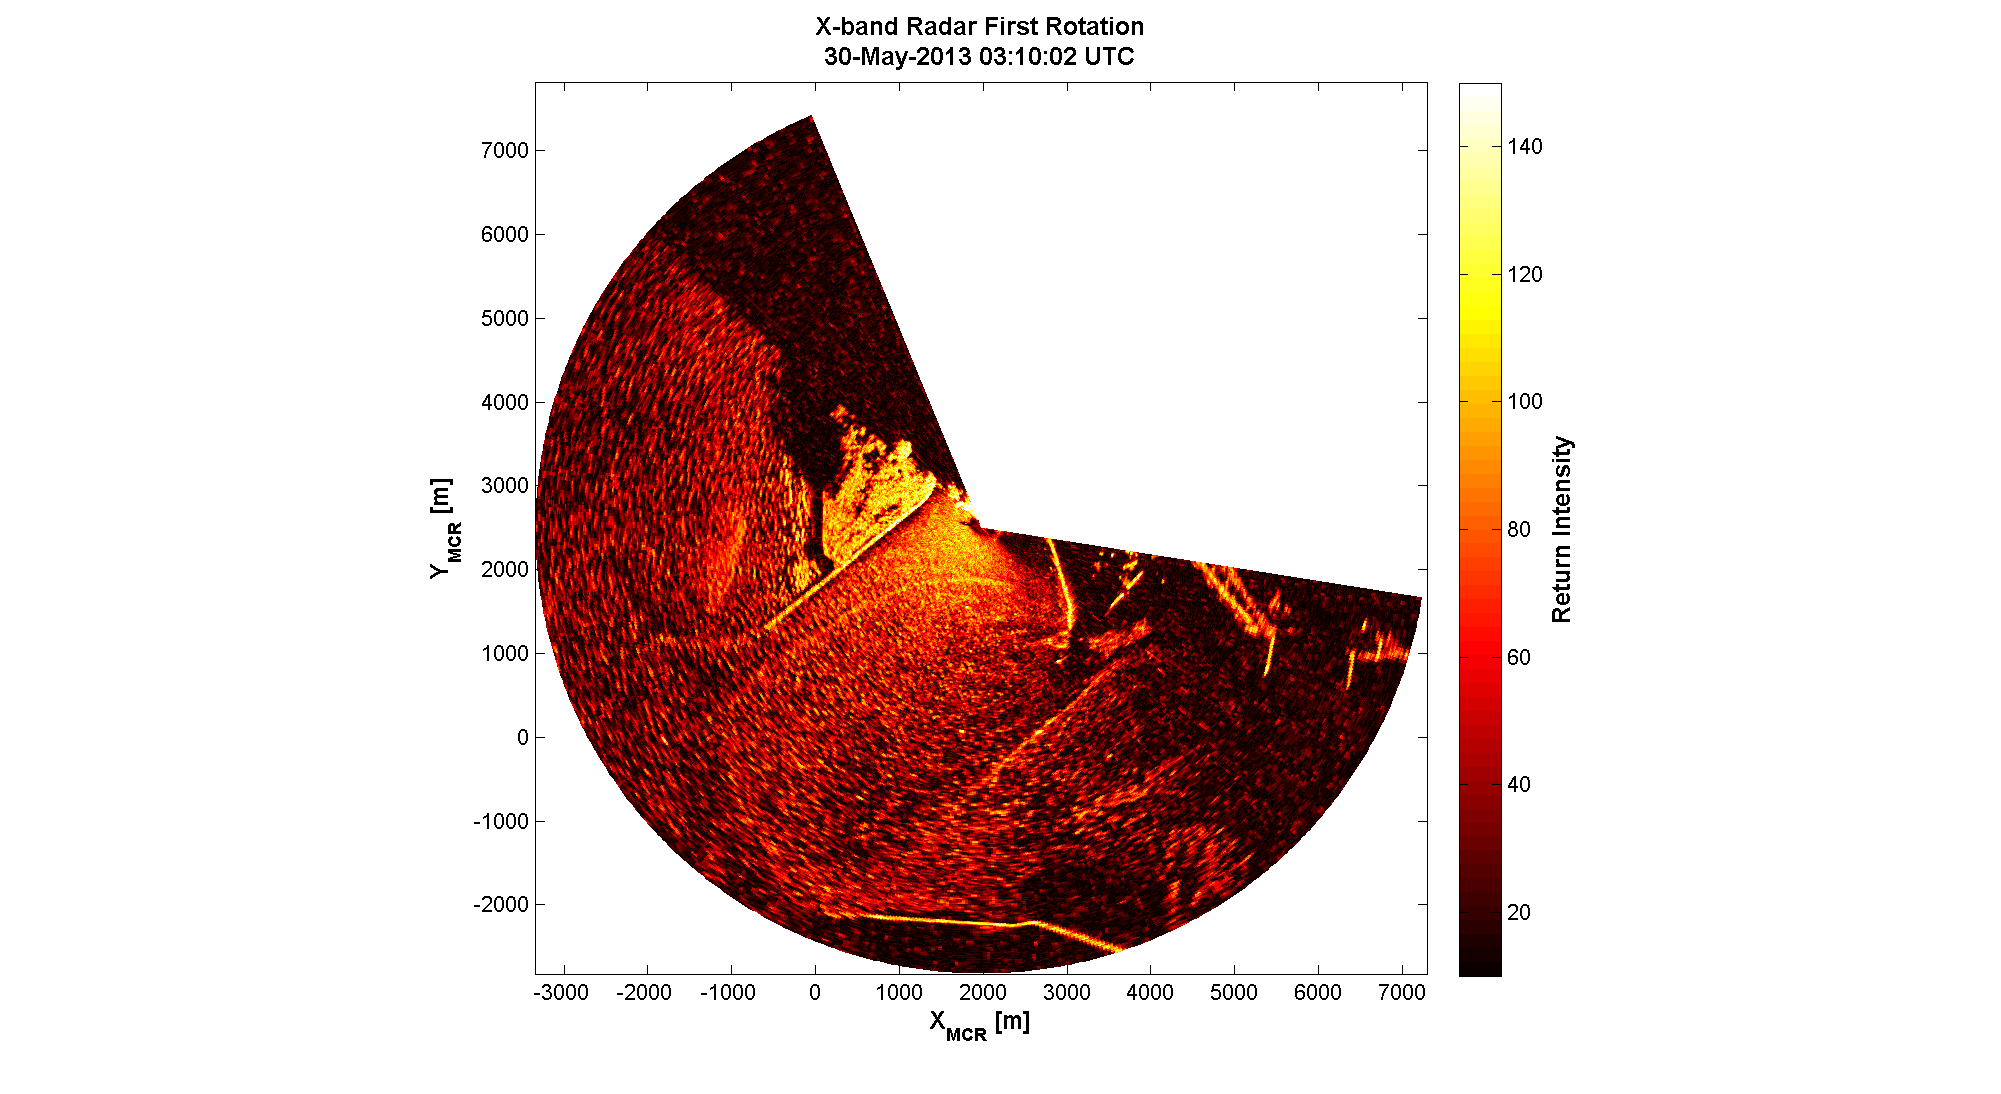
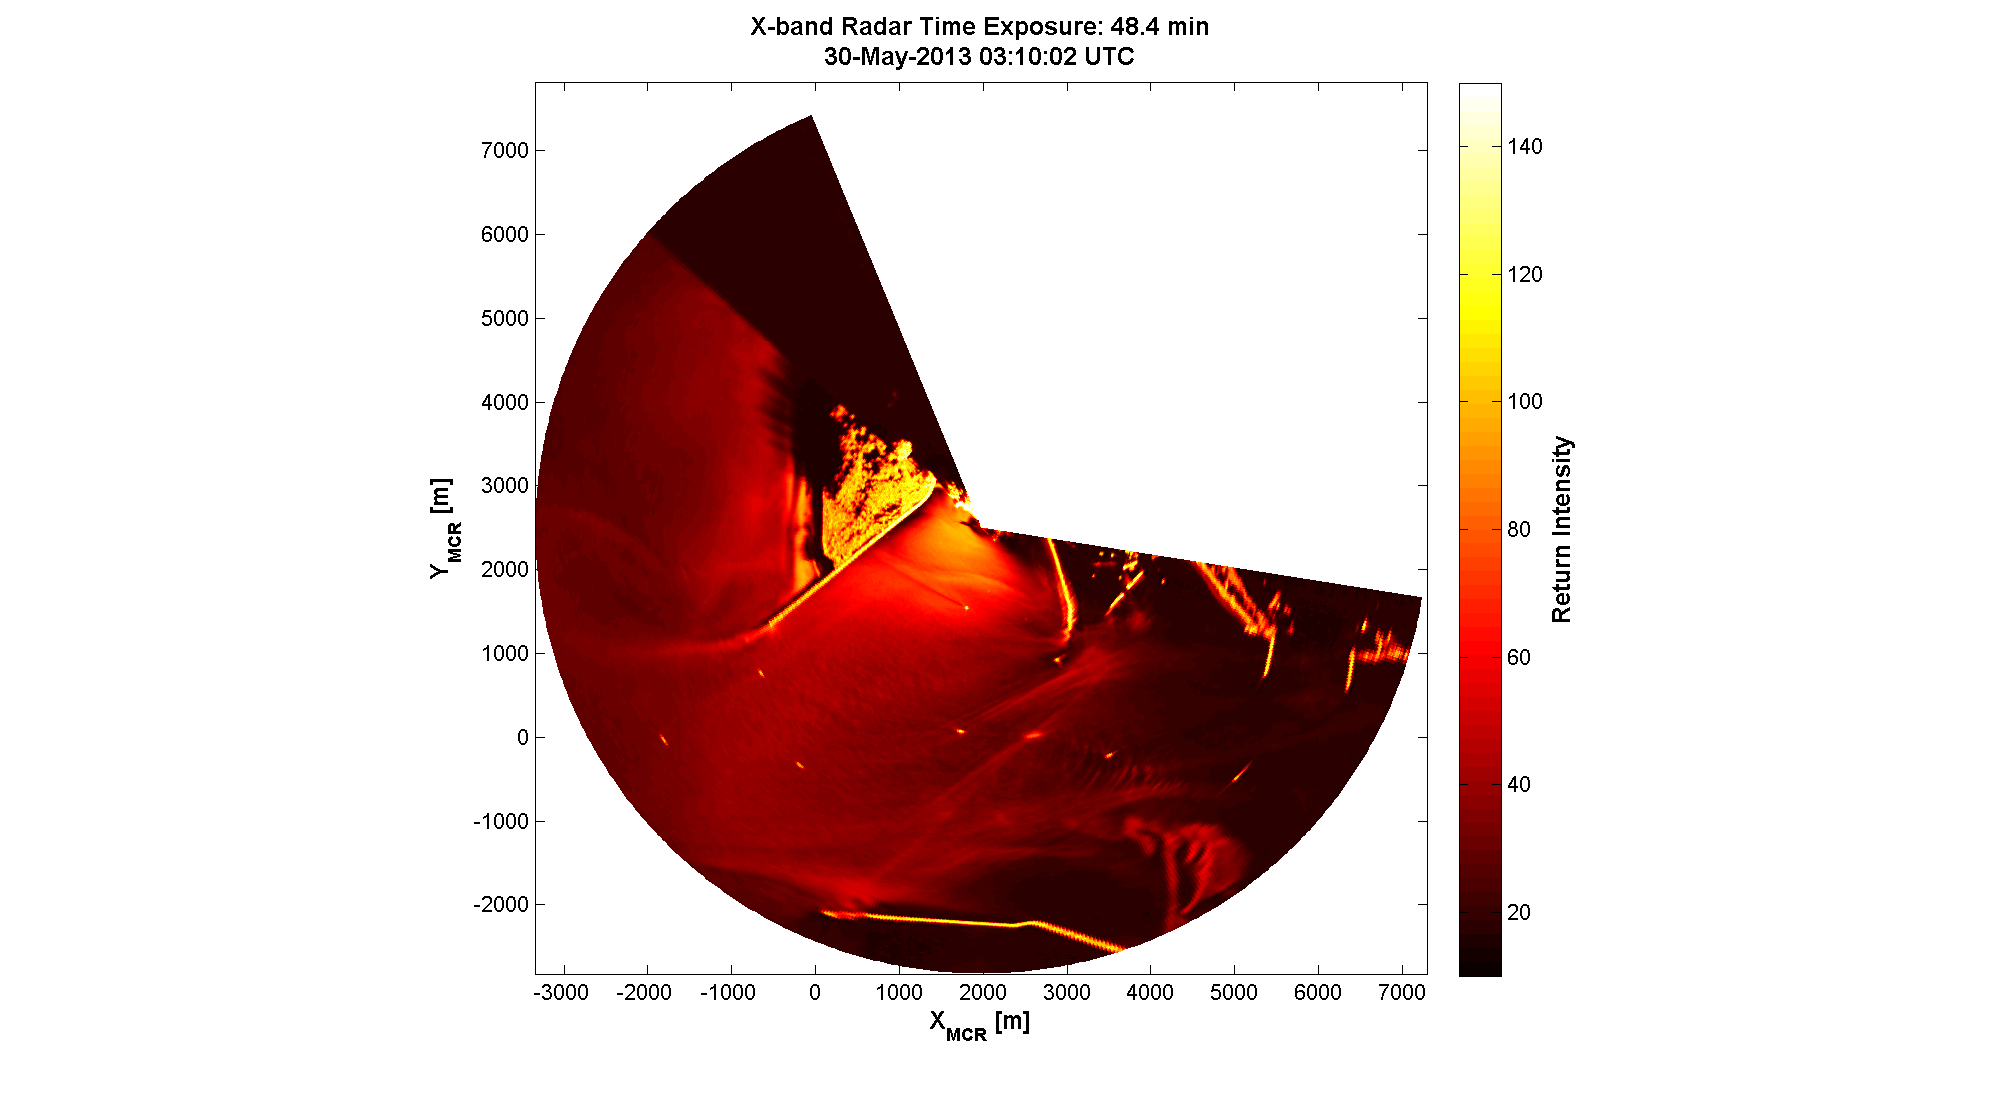
Below are example products from a 48 minute (2048-rotation) burst beginning at 8:10 pm PDT, 30-May-2013. The local coordinate system is a simple UTM offset with the origin between Columbia River Mouth jetties.
|
|
(click for full resolution)
The first rotation of an observation run, this is the marine radar equivalent of a "snapshot." The pixels displayed in the map are not collected at exactly the same moment due to the antenna rotation speed; however, a complete 360 degree rotation is typically completed in only 1.2 seconds. Evident in these images are crests in a steepening and breaking wave field.
|
(click for full resolution)
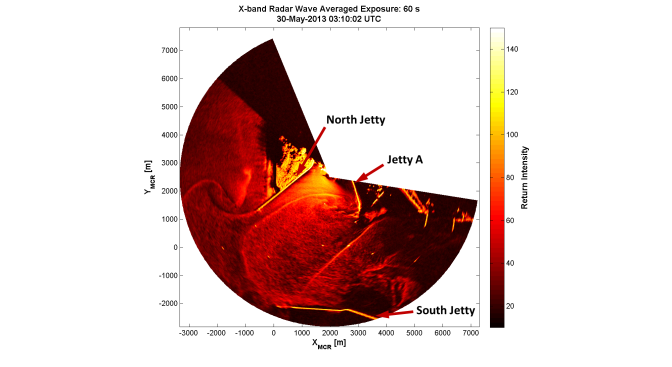
A lowpass temporal filter with a cutoff period of approximately 60 s is applied to each pixel of the image time series. This suppresses the dominant surface gravity wave signal and reveals sub-wind-wave processes. This new data product can show rip currents and plume front evolution. Image sequences (movies) are shown in the next section.
|
(click for full resolution)
The temporal mean for each pixel is calculated and displayed. Because return intensity from the coastal ocean is more often dark than bright, the timex values of interest typically lie at lower values. Thus the image color axis is cropped to enhance contrast. These images best show spatial patterns in the steepening and breaking wave field, as well as the locations of bright, solid objects such as the coastline or a reflective buoy.
|
2. Wave-averaged time series
|
|
A typical movie product is created from an image sequence of 1024 images collected over a time period of 22 minutes, twice per hour. Next, the full time series is low-pass filtered with a cutoff period of 60 seconds, eliminating high frequency variance due to wind-waves from the signal. So that the movie plays smoothly, the filtered time series is returned at the same time steps as the unfiltered time series. Resulting image time series more clearly show front position and evolution, as well as the advection of surface roughness patches. The full-length movie of wave averaged time series at the MCR can be found HERE (Very large: 1.6 GB). This time series spans 10 May - 13 August, 2013. Data gaps in time are required for system overhead and maintenance.
NEW: A wave-averaged time series movie with supporting environmental and in-situ data can be found HERE (Large: 430 MB). Supporting data includes:
- Tide level: NOAA Station 9439011 (Hammond, OR); Mean Sea Level datum.
- Wind: NOAA Station 3CLO3 (Clatsop Spit, OR). Vectorized 15 minute and 12 hour averaged winds are displayed.
- Wind: NOAA Station 82SW1 (Cape Disappointment, WA). Vectorized 15 minute and 12 hour averaged winds are displayed.
- Currents: USGS Tripod MCR13W1T (46.26505,-124.06505). 60 second mean profiles (East, North, Up) are displayed, along with chosen vectors at the deployment location. Vector colors correspond to circle colors in vertical profile. Data courtesy of Guy Gelfenbaum & Andrew Stevens).
- Other sensor availability: Availability of concurrent remote sensor data is shown, including optical (OSU), stationary infrared (APL-UW), aircraft infrared (APL-UW) and aircraft ASAR (APL-UW).
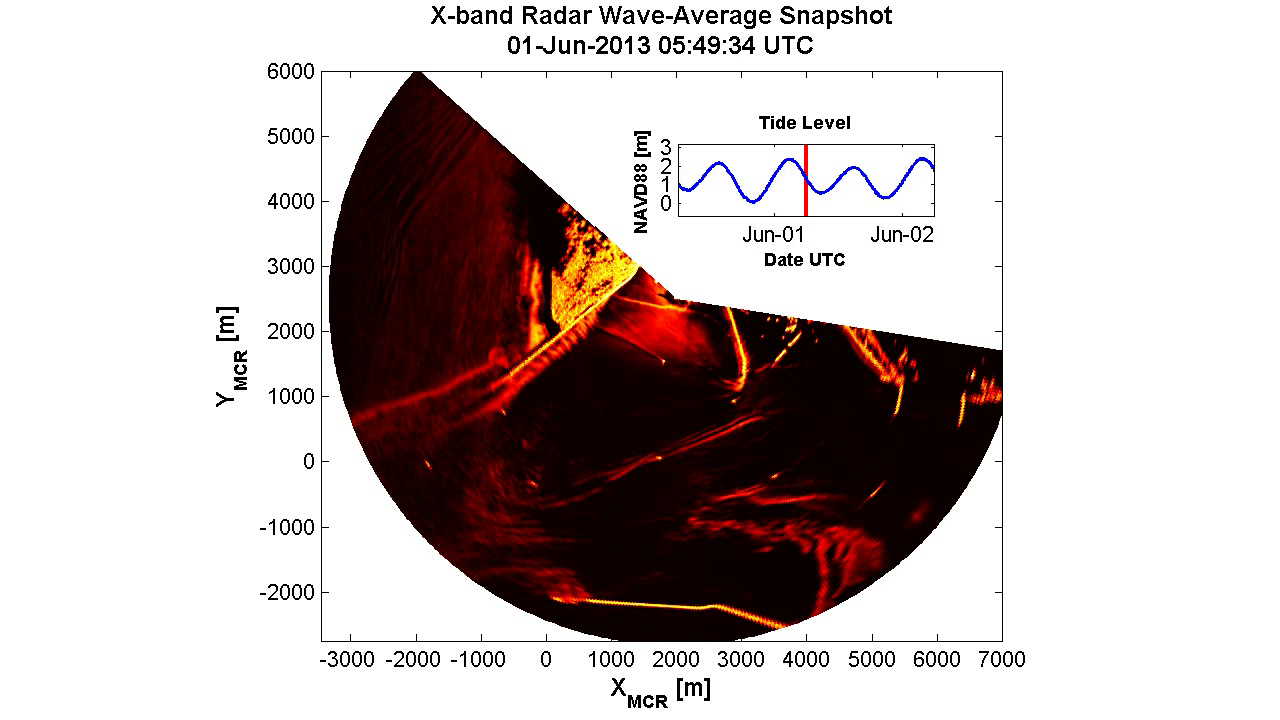
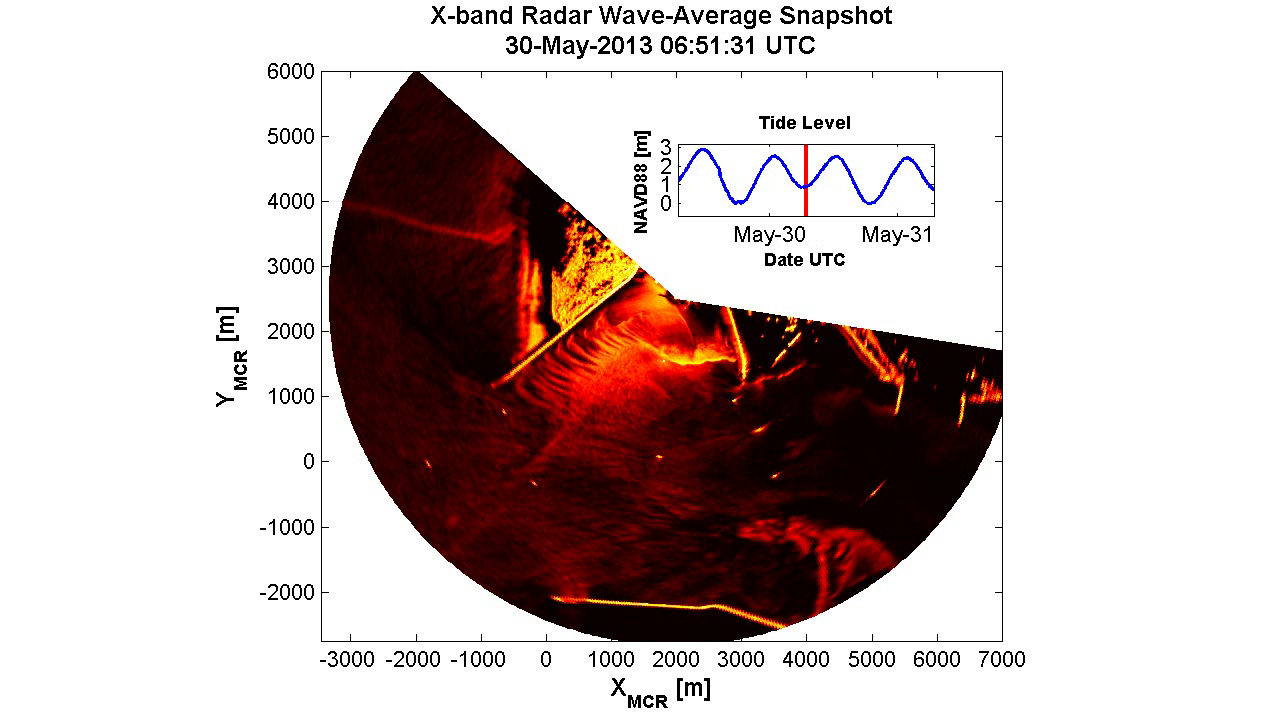
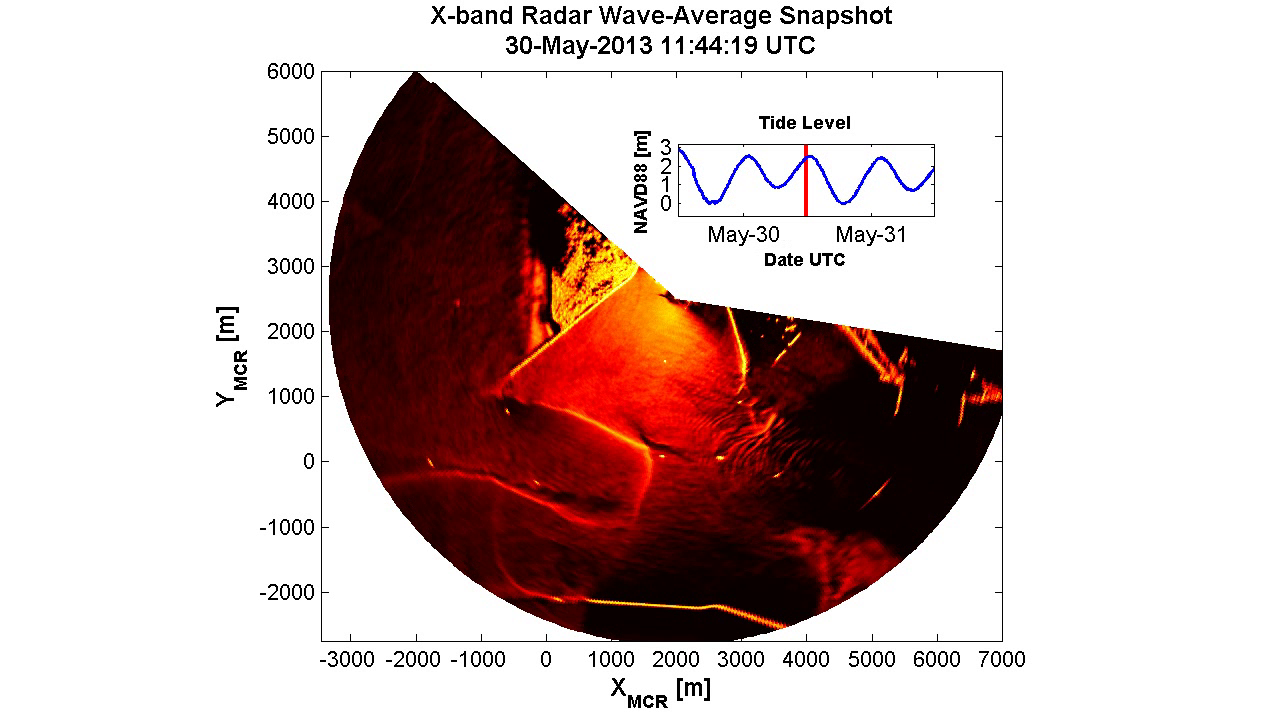
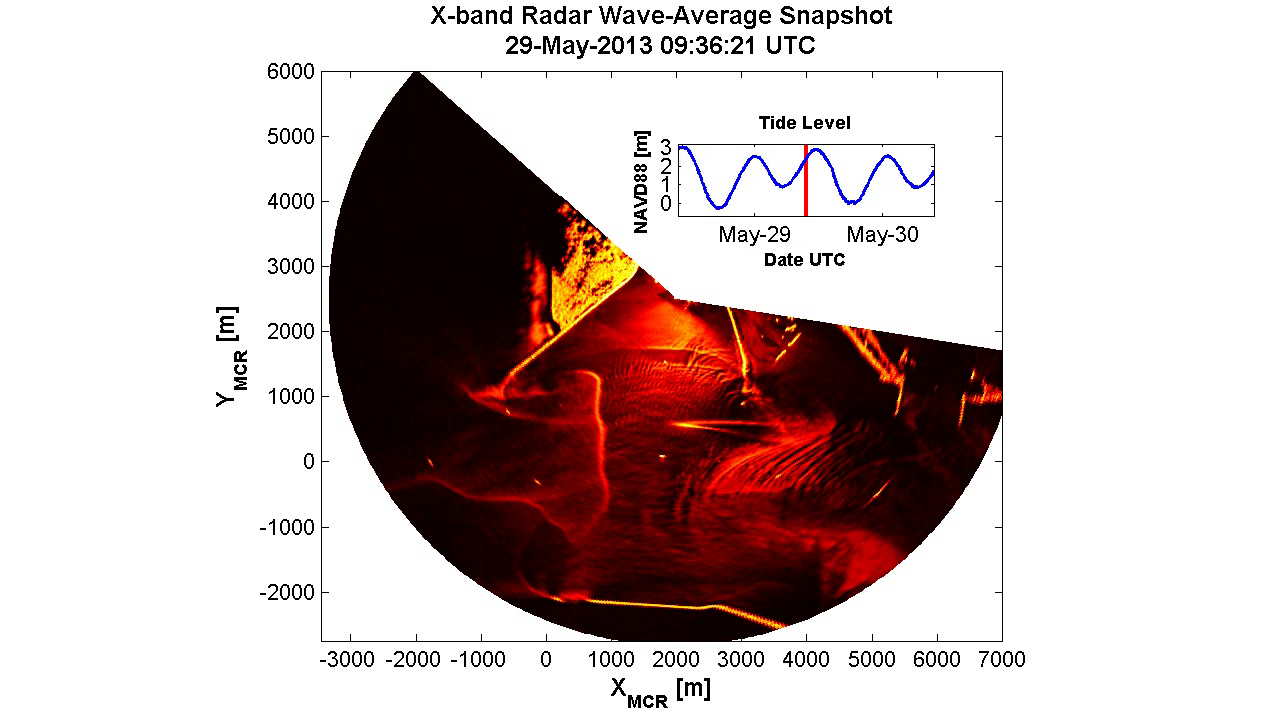
Below are images and movies of example MCR phenomena imaged by the radar. Tide level (acquired from the NOAA tide gage at Hammond, OR) is displayed in the upper right of each image, and the reported time is in UTC.
|
|
(click for full resolution)
(.avi movie HERE)
|
A lateral front appears as ebb increases toward maximum flow and initiates a series of complex events. This ebb front is seen to travel rapidly downriver. Once downstream of the first lateral constriction (Jetty A), the front spreads, eventually colliding with the North Jetty. At this time a pre-existing front attached to the North Jetty becomes dislodged and propagates north along Benson Beach. The portion of the front that collides with the North Jetty transforms into a series of convergence cells of jetty-parallel length scale 100 m and jetty-normal length scale 500 m. Near the end of the movie, these cells begin to diverge as an anti-cyclonic eddy develops directly to the west of Jetty A, with some advecting into the eddy and others advecting offshore. (Bonus: Two internal wave groups are visible in the image to the left, propagating toward Benson Beach from offshore.)
|
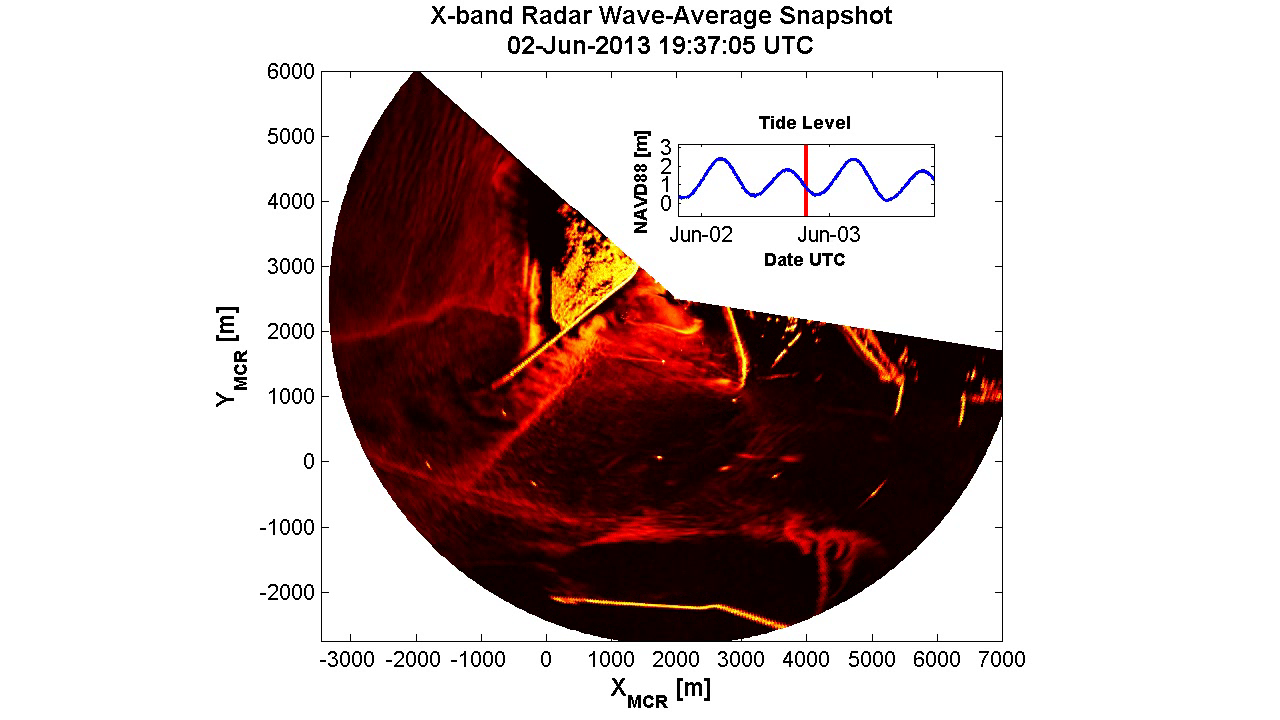
(click for full resolution)
(.avi movie HERE)
|
Approaching and during some ebb maxima, a crossing frontal pattern is established at an angle of approximately 15 degrees with respect to the North Jetty. At times, a second front appears to the south and intersects the northern front. This frontal crossing pattern is reminiscent of patterns seen in high Froude number open channel flows (see e.g. Akers and Bokhove [2008] Figure 8).
|
(click for full resolution)
(.avi movie HERE)
|
A third ebb front arises near Cape Disappointment within Middle Grounds near maximum ebb, and its orientation suggests the role of a leading edge of an anti-cyclonic mesoscale eddy induced by ebb flow around Jetty A. The front itself propagates eastward and then southward within Middle Grounds, finally coming to a brief quasi-steady state directly in the lee of Jetty A, oriented roughly parallel to ebb flow. Near the transition from ebb to flood, the front is ultimately released and propagates southeast toward Clatsop Spit.
|
(click for full resolution)
(.avi movie HERE)
|
A flood front is observed to detach from the north jetty tip and propagate upriver with an excursion up to 6 km before weakening at slack and turning with initial ebb flow. The front trajectory does not appear bound to the river axis, travelling northward into Middle Grounds at times and southward toward the base of the South Jetty at others. Variability in trajectory is accompanied by variability in shape: When the front travels northward, strong lateral shear within Middle Grounds due to the North Jetty tip appears to control the northward edge of this flood front. When the front travels southward, the front’s shape appears more jet-like and less directly tied to lateral constraints.
|
(click for full resolution)
(.avi movie HERE)
|
A striking standing-wave event occurs most often during flood, as flow moves into the estuary. Standing-wave-like patterns of varying (wave-) length scale and orientation appear near Jetty A and Clatsop Spit shoals. In the image and movie to the left (note 09:30 UTC), three different standing wave patterns are visible. One set of features spans the region between the propagating flood front and Jetty A and exhibits a nearly uniform wavelengths of 50-60 m. The crest orientation is roughly flow-normal. A second set appears directly west of Jetty A is nearly superposed upon the first, but exhibits a broader range of wavelengths around 120 m. The crests are oriented radially away from a bathymetric pit located directly to the south of Jetty A. A third set of wave-like features appear between Jetty A and Clatsop Spit shoals, with crests oriented in a roughly in a flow-normal direction. The wavelength scales of this group are also broad, but typically vary between 80 m and 150 m. (Note: large, translucent features rapidly propagating northward are rain cells.)
|
3. Wave field analyses
|
|
X-band marine radar spatio-temporal resolution of surface gravity waves permit analysis of wave field transformation over bathymetric gradients and through mean flows. Varying bathymetry is co-located with strong, time varying tidal flows between the Columbia River jetties and beyond to the ebb shoals. 3D-FFT techniques can well-represent changes in wave field parameters within locally uniform regions. More complex techniques (e.g. cBathy) increase analysis resolution in regions of sharp gradients, and further utilize frequency-wavenumber pair information to estimate local depth.
|
|
(click for full resolution)
|
A
(click for full resolution)
C
(click for full resolution)
E
(click for full resolution)
|
B
(click for full resolution)
D
(click for full resolution)
F
(click for full resolution)
|
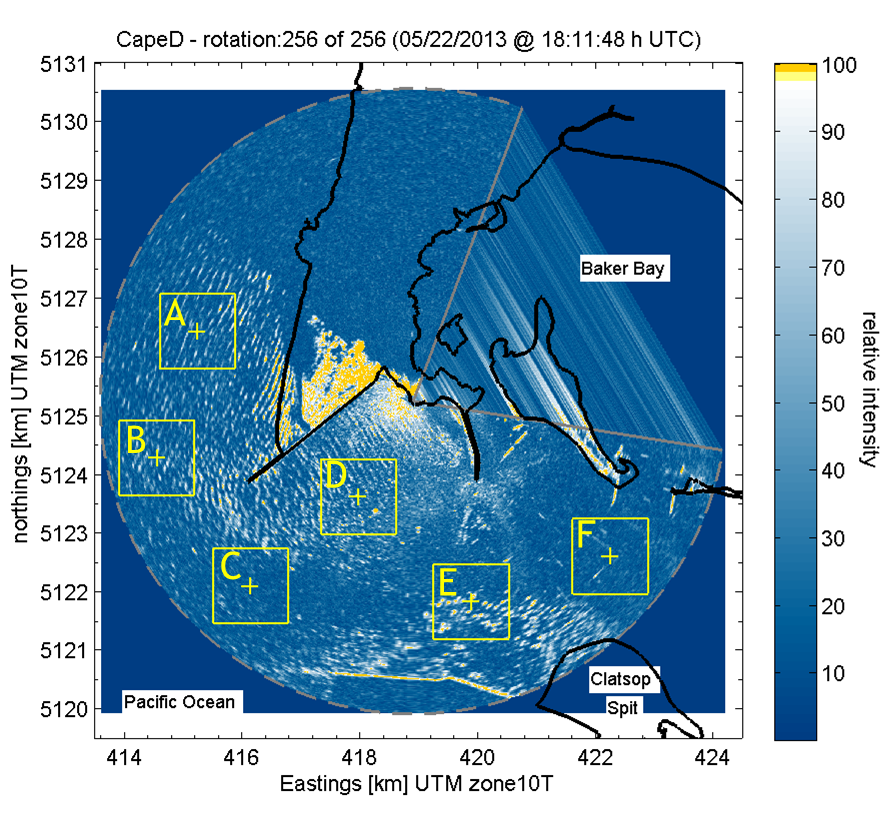
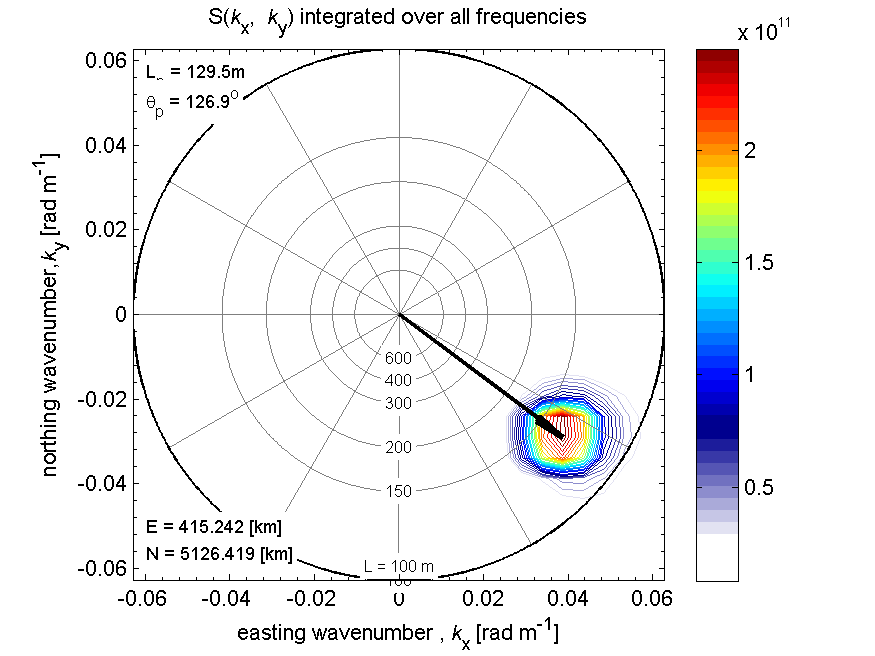
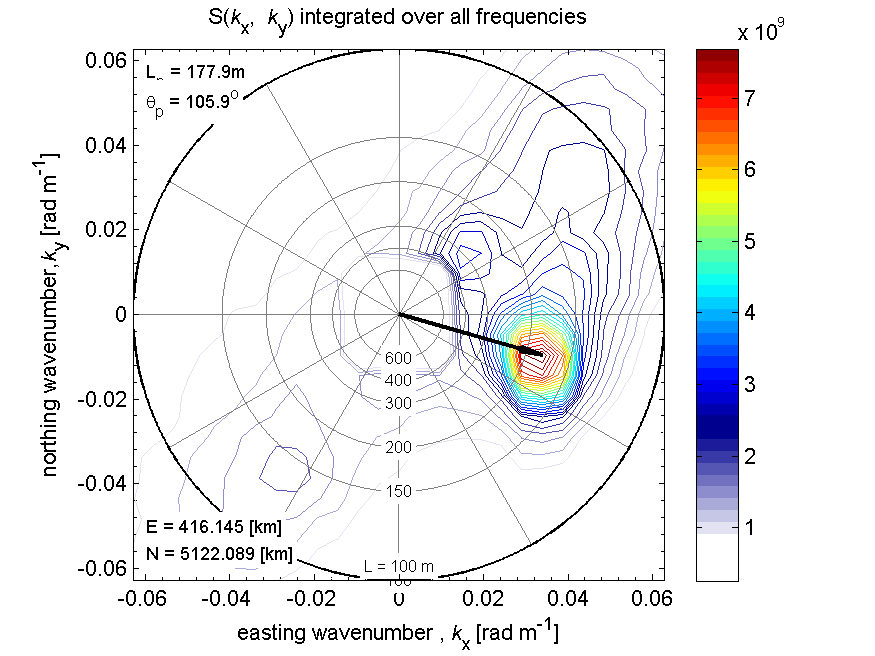
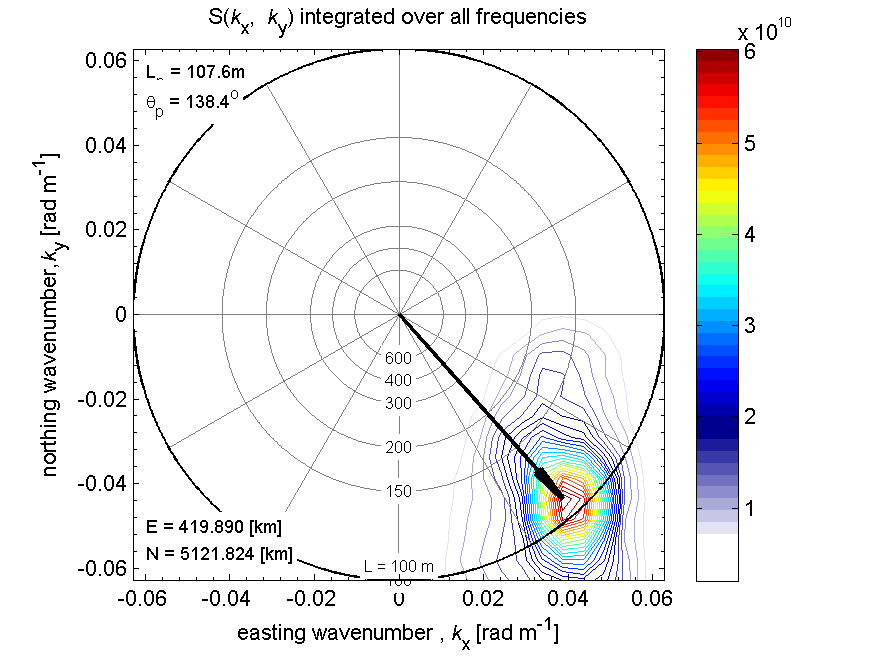
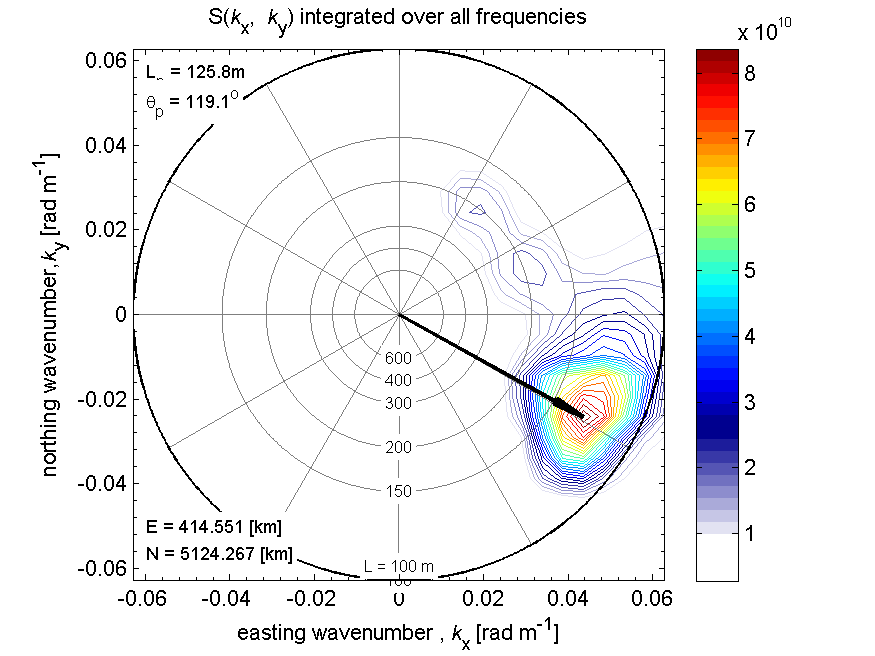
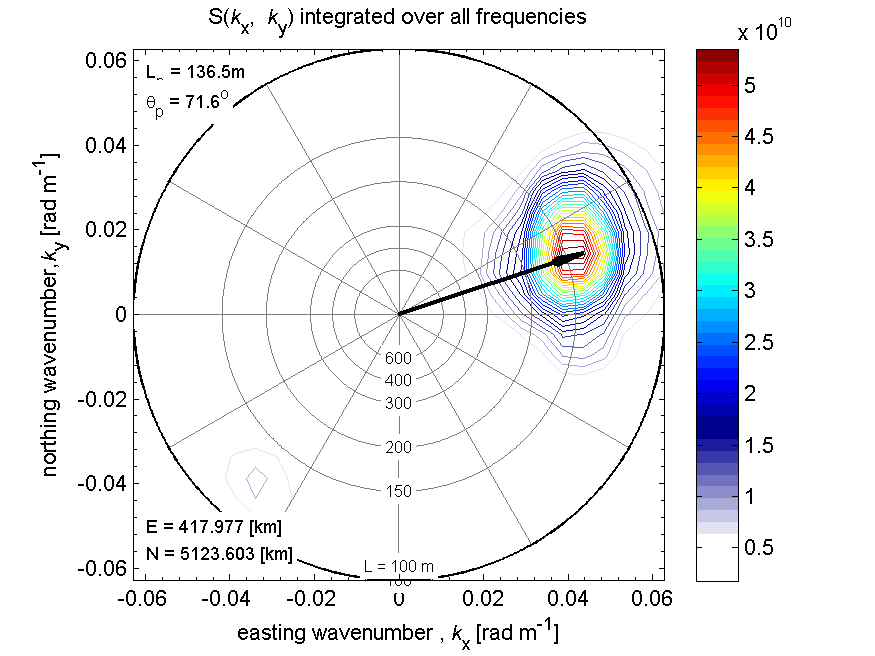
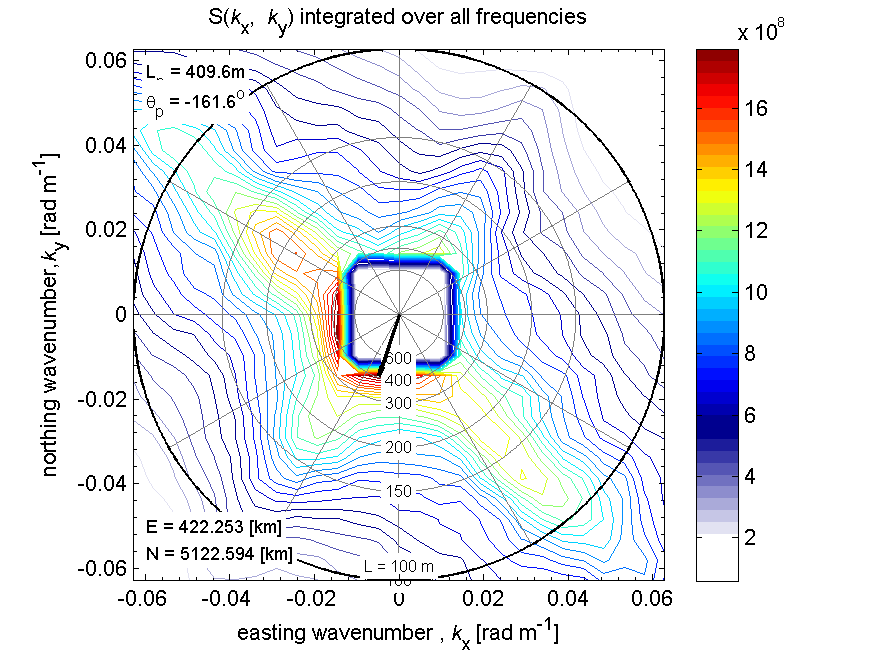
In order to assess the characteristics of the wave field in the vicinity of the MCR from radar measurements, a series of frequency integrated wavenumber spectra S(kx, ky) are computed from various locations within the radar footprint and analyzed following Young et al. [1985]. The spectrum is computed from radar-intensity subimage timeseries through 3-D Fourier analysis. Subimages are squared, about 1.3 km on the side, and each 5-plus-minute long timeseries has 256 of them. Dominant wavelength Lp and propagation direction θp are derived from the peak of the spectrum.
In the following example, evolution of the wave field is estimated from a radar collection recorded on May 22, 2013 @ 11:11h local time (18:11h UTC). Spectra are calculated at six locations (boxes A through F on the radar snapshot) from off-shore to up the estuary. Concurrent wave conditions measured in-situ by NDBC buoy 46243 (located about 9-km west of Clatsop Spit at 25-m water depth), were Hs = 2.6 m, Tdom = 9.9 s, Tavg = 8 s and θavg = 275 deg.
It is interesting to note the spatial variability of wave conditions in the vicinity of the MCR. Off Benson beach and West of the North Jetty (spectra A and B), 130-m long waves propagate from the NW. At the mouth of the Columbia River (C), θp closely resembles the buoy data but Lp increases to almost 180 m, likely due to the waves propagating over the rising tide (i. e., de-shoaling). Due to diffraction caused by the North Jetty, at D, propagation direction has shifted further (72° from N) and Lp has decreased back to 135 m. Meanwhile, at E, depth-induced refraction results in de-shoaled waves shifting toward the SE and shortening to about 108-m wavelength. Further up the estuary (F), wave conditions are not discernible because the Fourier analysis breaks due to low signal-to-noise ratio.
(click for full resolution)
|
(click for full resolution)
|
(click for full resolution)
|
(click for full resolution)
|
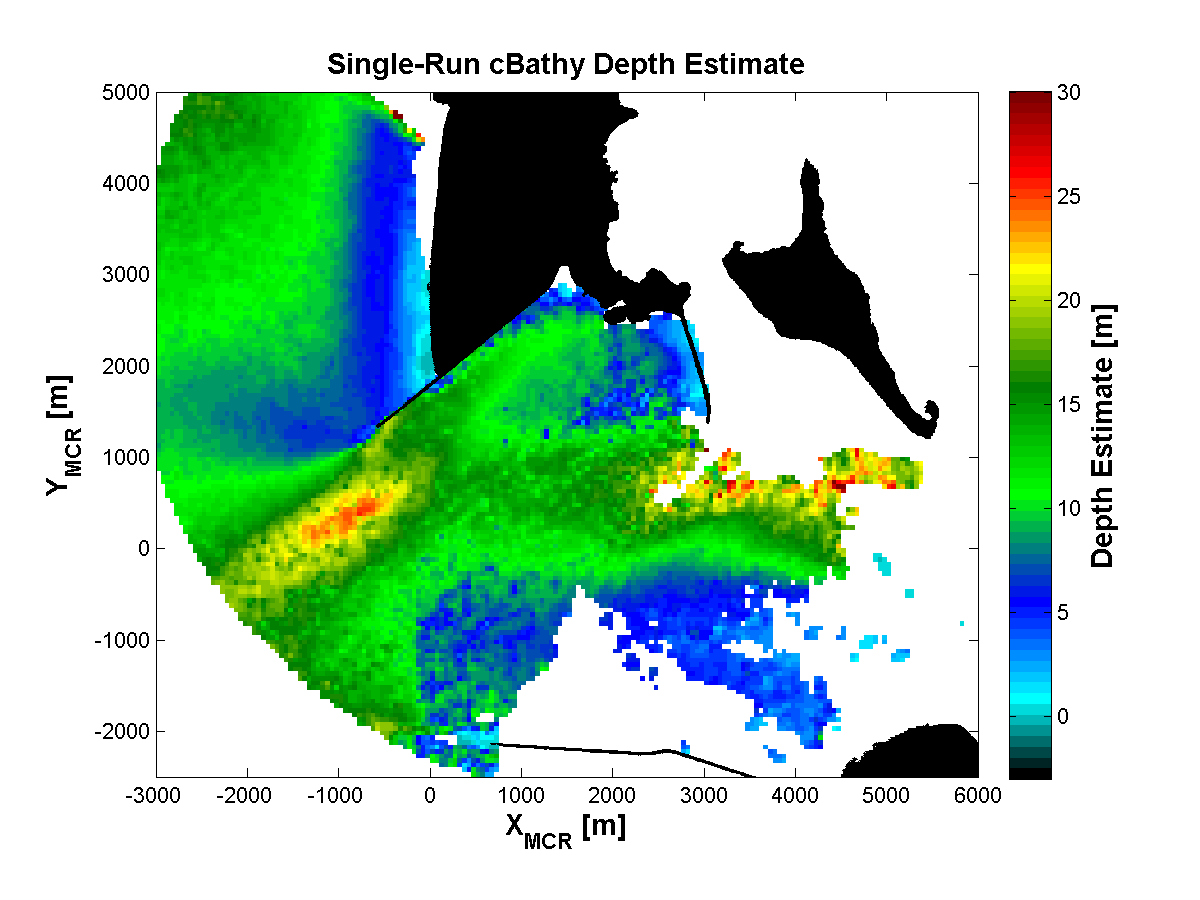
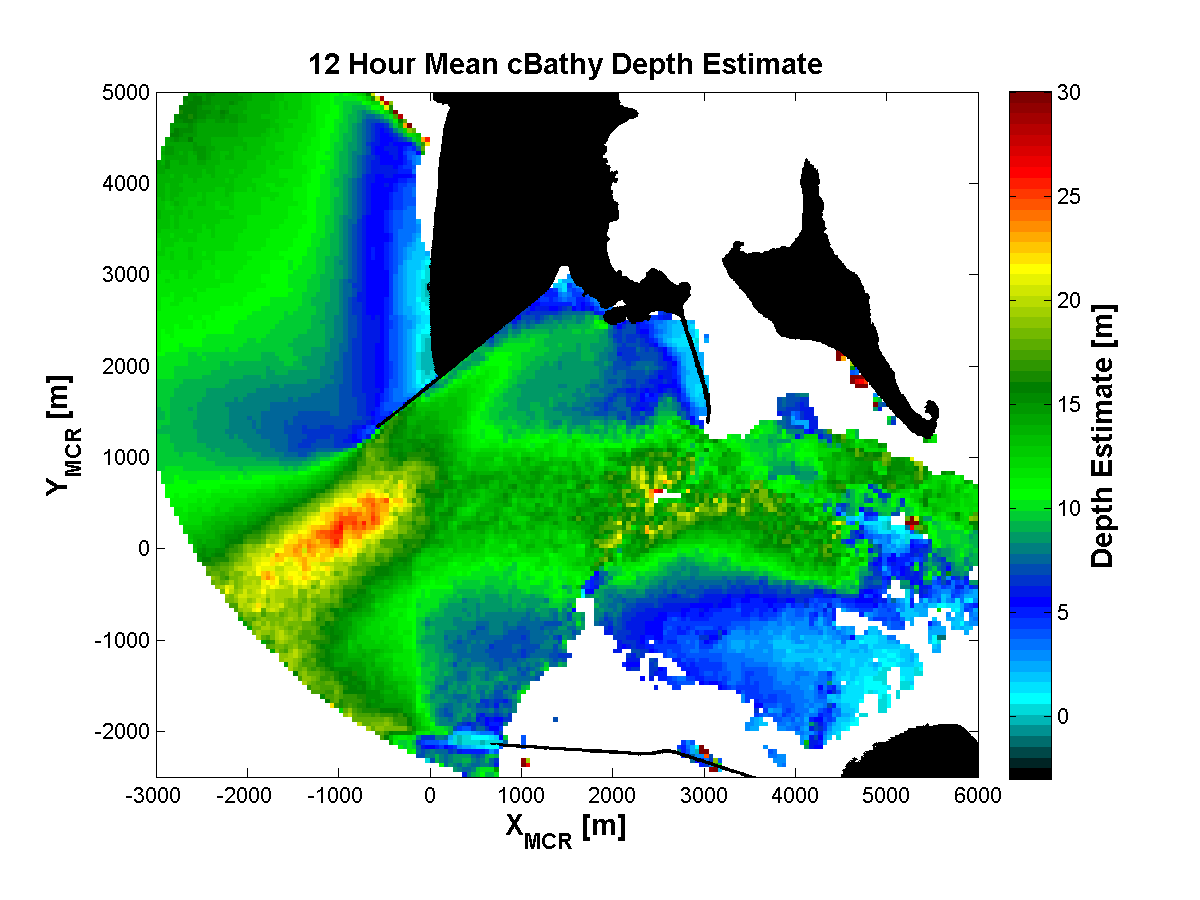
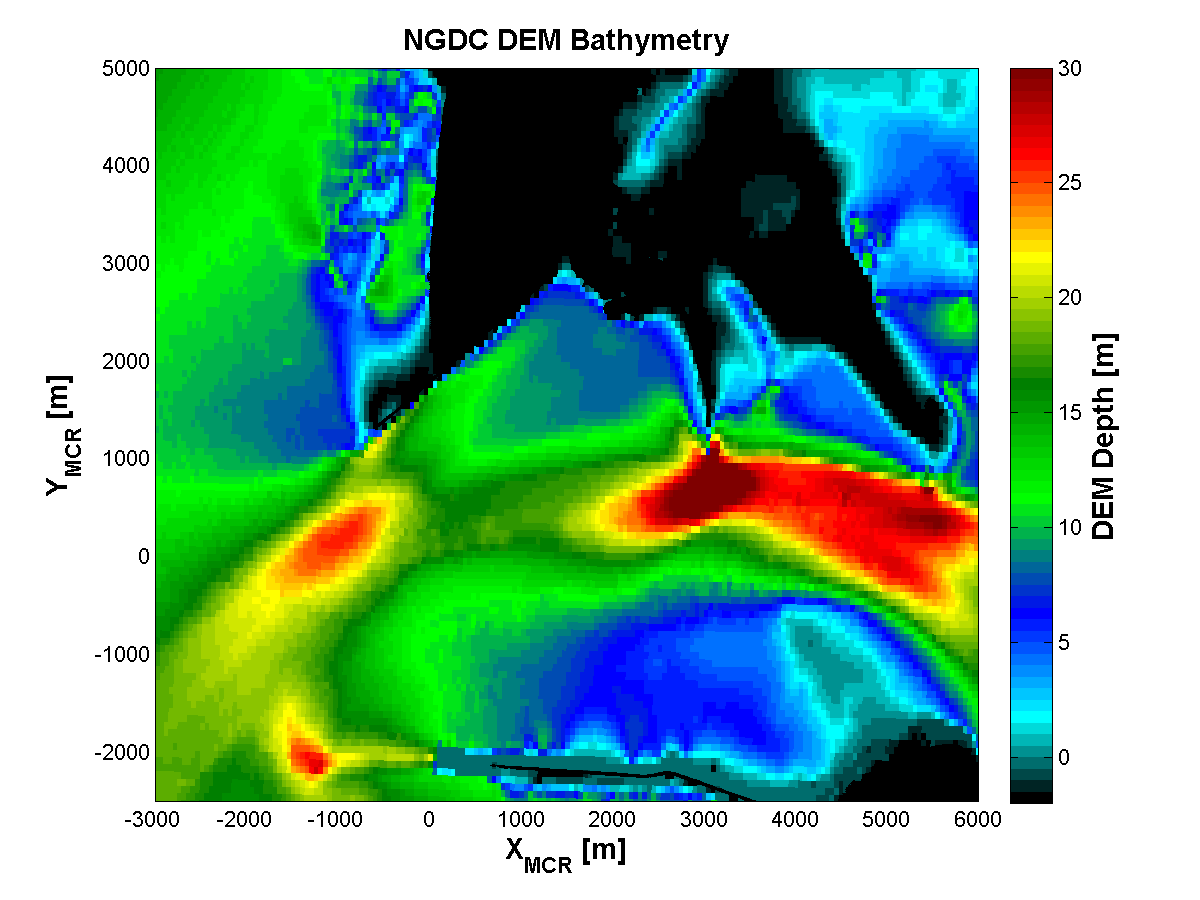
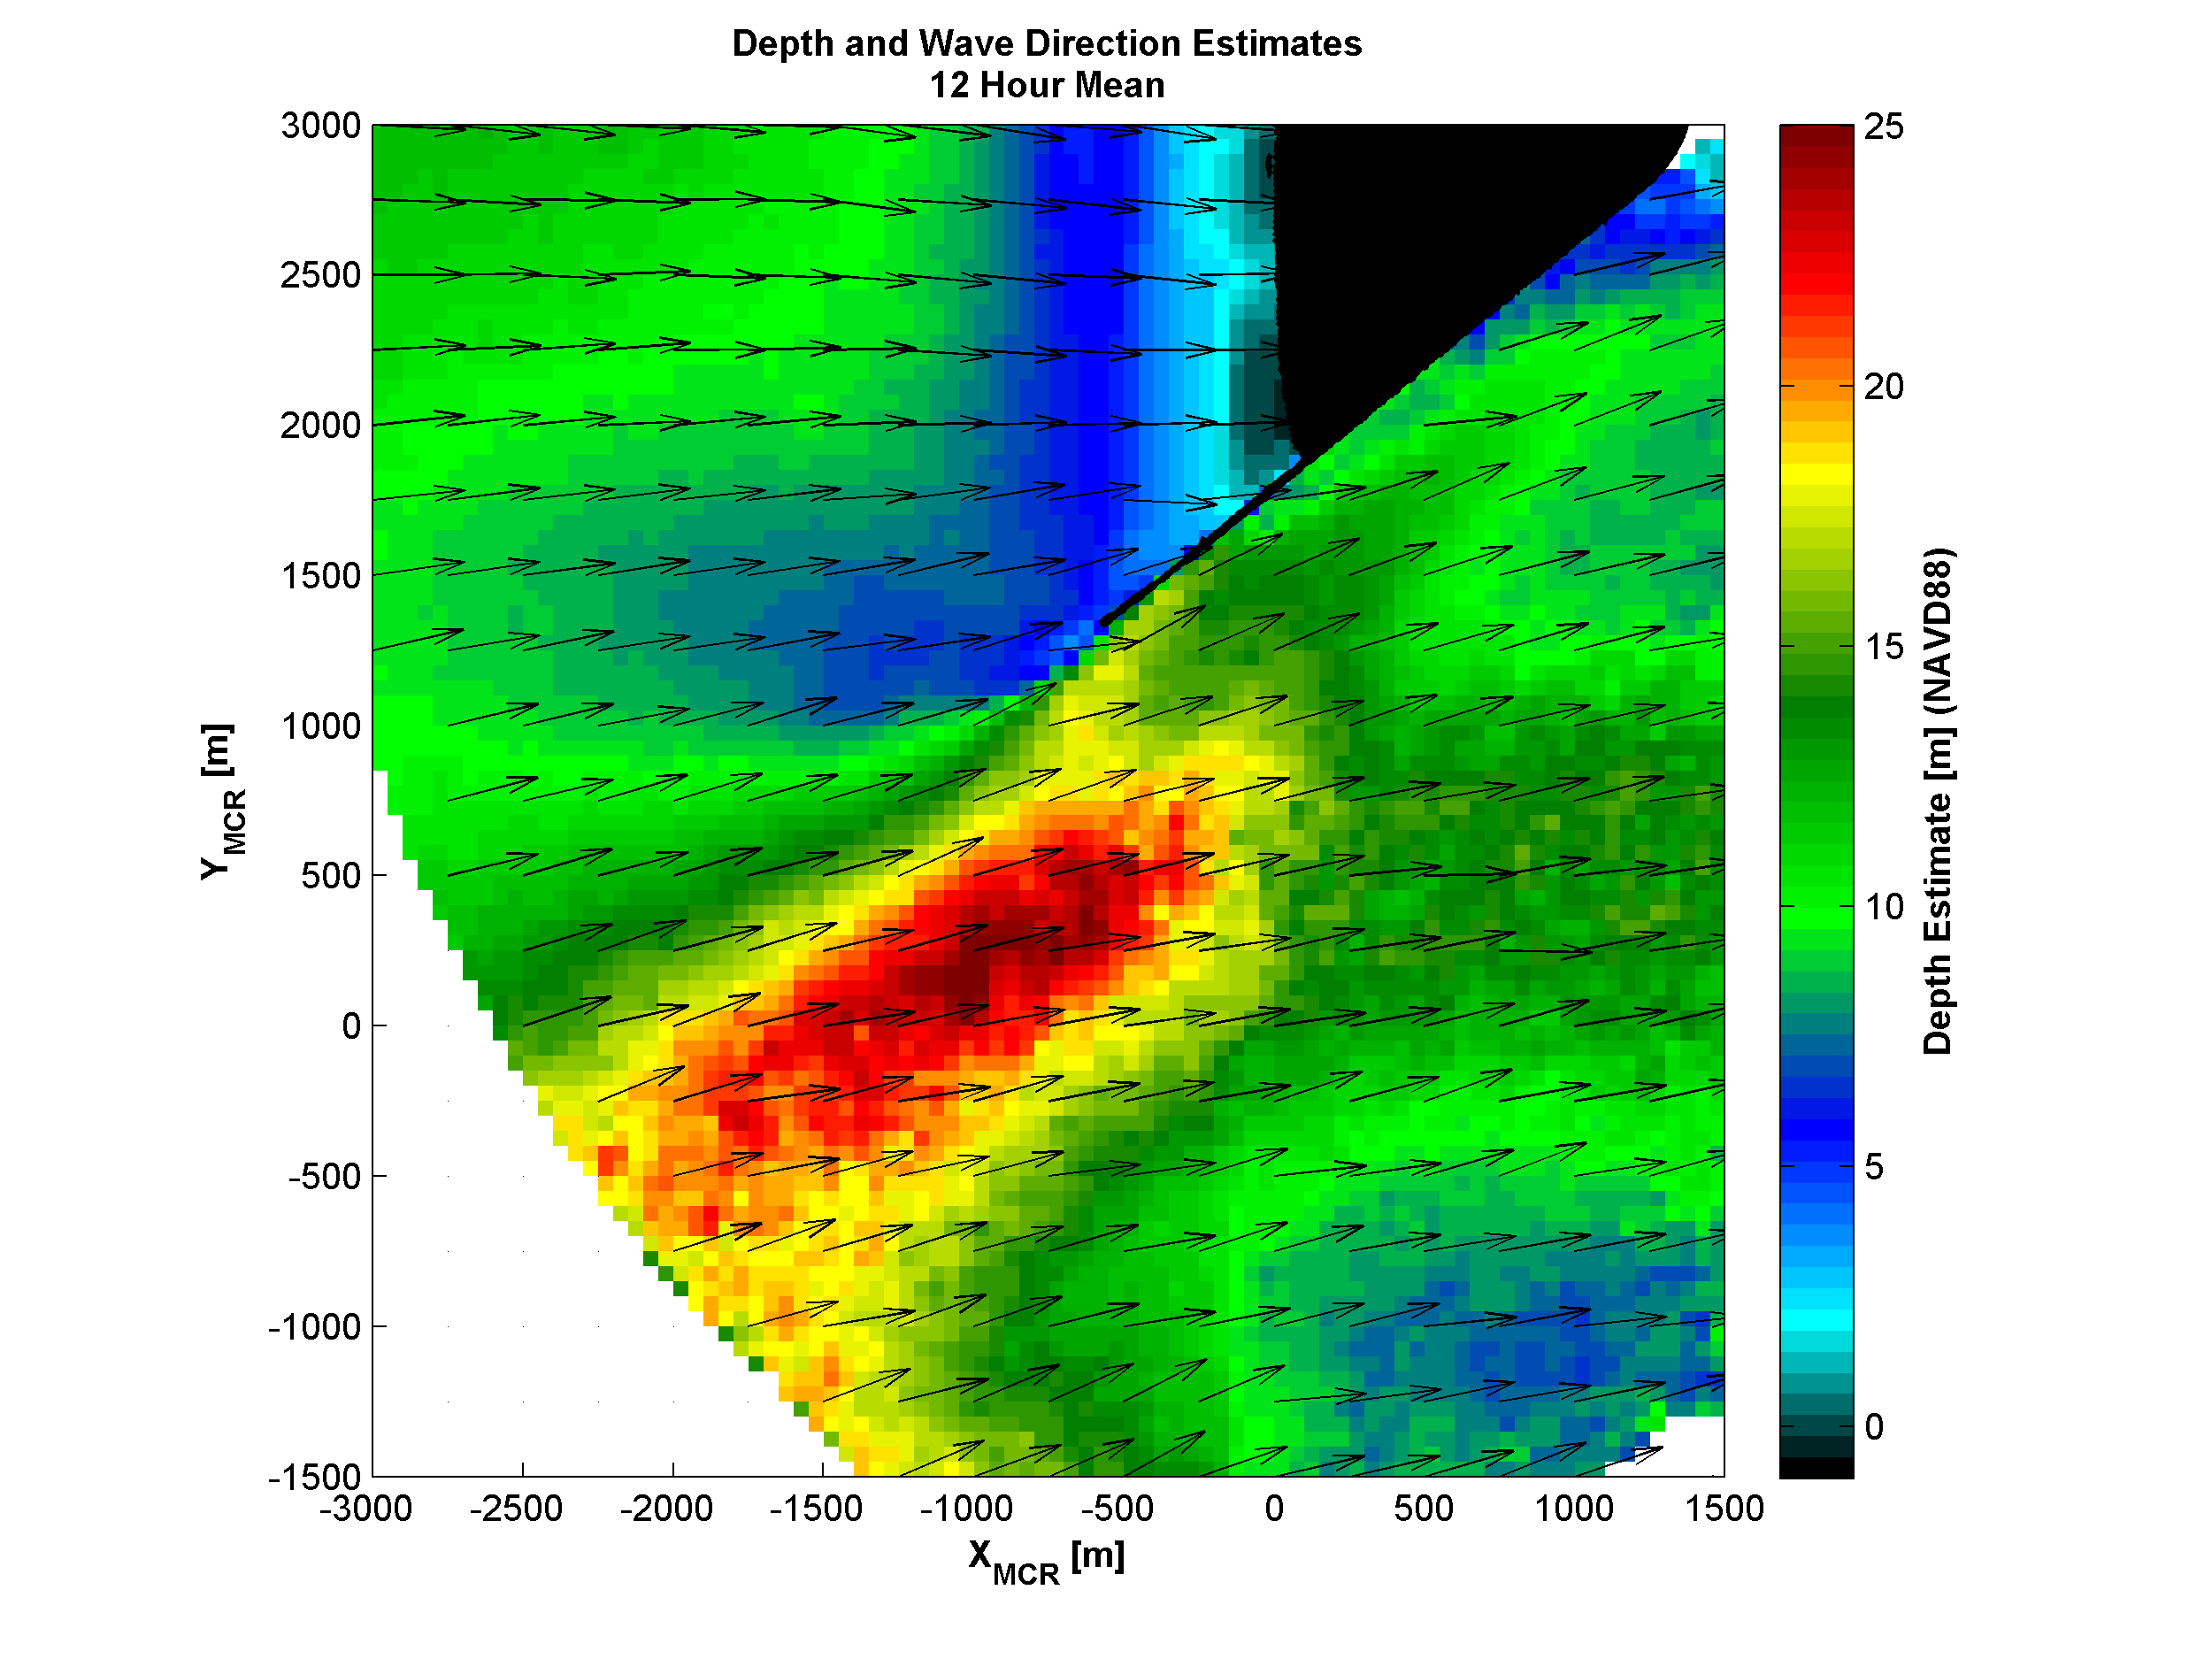
Upper left: Depth estimate map from a 20-minute time series near slack. Upper middle: 12-hour (or crude tide-averaged) mean of 24 20-minute time series. Upper right: "Tsunami Inundation" digital elevation map (DEM), a depth-survey concatenation product issued by NGDC. Note that the rapid bathymetric gradients along Benson Beach to the north are suspect. Left: Wave directions are plotted atop depth estimates in a detailed view near the North Jetty. Note the different color axis limits between this image and the others. Vectors shown are subsampled for clarity.
The cBathy algorithm (see Holman et al. [2013]) has been exploratively implemented throughout the 7 km radius MCR footprint, with promising results. While averaging over time smooths the depth estimates and fills in gaps, the estimate based upon a single 20 minute time series resolves many of the underwater features in the DEM (with one notable exception being the deep region adjacent to Jetty A). Visible gradients in the 12 hour mean wave direction vector field indicate bathymetric refraction. Further analysis will study the effects of mean currents on wavenumber vectors and depth estimates at this location.
|
Additional WIMR products available upon request. Please contact Mick Haller at merrick DOT haller AT oregonstate DOT edu.
|
